Dealer Promote

How to Get to Your Goal of Cars Sold

Torture Your Numbers

Hello Everyone this is John with DealerPromote.com and welcome to today’s topic of our Web Series: “Torture Your Numbers Until They Speak”. Today, we are going to discuss the topic of Flying Mode Ratios and Numbers to Get to Your Goal of Cars Sold

Alright, so here is the deal. In today’s video we are going to try to answer the following items:

  • What’s Your Number of Cars Sold?
  • How do you get to that number?
  • Percentages and numbers in each stage?
Get the Free Tool

DealerPromote.com places your inventory Ads in front of the most relevant buyers possible. Using the power of Advertising AI and machine learning, combined with your Inventory and CRM data. Showing the right Ads at the right time.

At the end of this video, you can find a free download tool. Don’t forget to use it! Each Video explores a topic related to automotive marketing. Stop by… You Are Invited!

Today we are going to discuss the ratios and calculations to get to this goal. The typical 7 stages including ratios are:

1. Leads

2. Appointment Ratio

3. Appointments

4. Show Up Ratio

5. Traffic

6. Approval Ratio

7. Cars Sold

The Key points that you need to benchmark and audit correctly inside your organization are: two, four and six.

Attention Warning

In our many years of experience in the car business, I can assure you that each time we speak to different roles at the dealership…almost 90% of the time they don’t know these concepts or act upon them. This exercise might seem very simple and dull, but I am sorry to say that many of you out there… Fail! There is a current pattern in Automotive; we don’t audit people, numbers, systems, and procedures. Reporting and numbers need to drive the organization to achieve your goals. Alright enough saying! Let’s get back to our topic!

So here is the trick

The best way to look at your goal of Cars Sold for the month is to flip the funnel, and put attention to your ratios going backwards. Let’s say that Dealership ABC, their number is 300 cars a month.

Let’s move to the next stage, continuing in reverse order. Out of the total Traffic that walks through the door,  How many people are you approving? Let’s assume that ABC Dealership works with subprime and their Approval Ratio is 35%, so right there we move into the Traffic step, using some simple math

If you approve 35% of the traffic and you need 300 cars sold. How many people should walk into your dealership? Show Up Ratio tends to be a controversial and usually an incorrect number because:

  • CRMs are full of inaccurate records; notes, phone activity, check-ins and lots of hands in the pie.
  • It’s easy to manipulate. Maybe some Appointments are made the same day of the show to look good in a manager’s eyes.
  • This ratio changes depending on the type of customer; used, new vs subprime.
  • Reschedule appointments, are counted differently across the board.
  • Consider an appointment confirmation team. This can make all the difference.

Use the free calculator at the end of the video and see the effect on your cars sold by just increasing a few percentage points in the show up rate.

Let’s now see how many appointments I need to get to the goal of 300 cars sold. Same math as before:

For this exercise let’s consider a 30% From appointments made to shows at the store. Ok great let’s summarized and let’s see how things are looking.

How things are looking

We are moving along down the funnel. Some reminders about the lead to appointment ratio:

  • Not all leads are created equal.
  • Adjust the pitch to the source and the stage.
  • Get to the specifics. Measure by agent and by source.
  • Phones and the people behind them can make or kill your sales goals.
  • Don’t be late, follow up, and get the right agent for the right lead.

We continue down the funnel. Now, we need to calculate:

1. How many leads Do you need a month for the number of appointments?

2. What’s the Lead to appointment Ratio, that can sale you X number of cars?

Let’s assume that:

  • Lead to Appointment Ratio is 40% overall
  • Your lead pipeline keeps growing month over month (No shows, previous traffic, previous customers maturity cycles)
  • Lead quality changes by acquisition channel and market. Focus on your average lead conversion.

Alright, let’s calculate your leads!

Now, this number of leads might look like a lot of leads to generate. Remember, our example is for selling a lot of cars a month. Its important to remember that we are considering:

  • All opportunities.
  • The money is in the people that say No.
  • Inbound and Outbound Call Activity
  • Maturity Buying Cycles.
  • Prospects and customers.
  • Retail and Service.
  • All store visits.
  • 90 days call to No shows

So here you have it, to sale this many Cars in an Environment like this you would need.

Let’s look, at these numbers counting 26 workdays in a month.

Excellent, we were able to get all our numbers!

Let’s summarize some important points:

  • Invert the funnel
  • Know Your numbers and Navigate towards your Goal
  • Find the real numbers
  • Audit your departments randomly. Count them simply. If you look at the example the daily numbers are not that large.
  • Share these numbers with your team to assess where to put the effort.
  • And finally, silence the complainers

“We have no leads, people’s credit has been horrible, we don’t reach anyone….and on an on…”

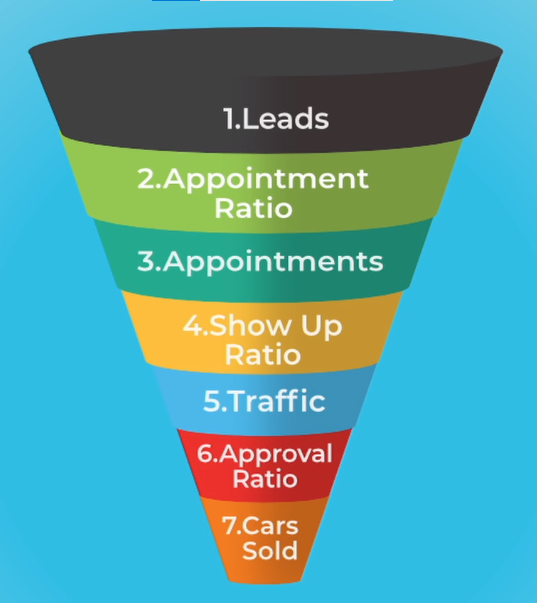
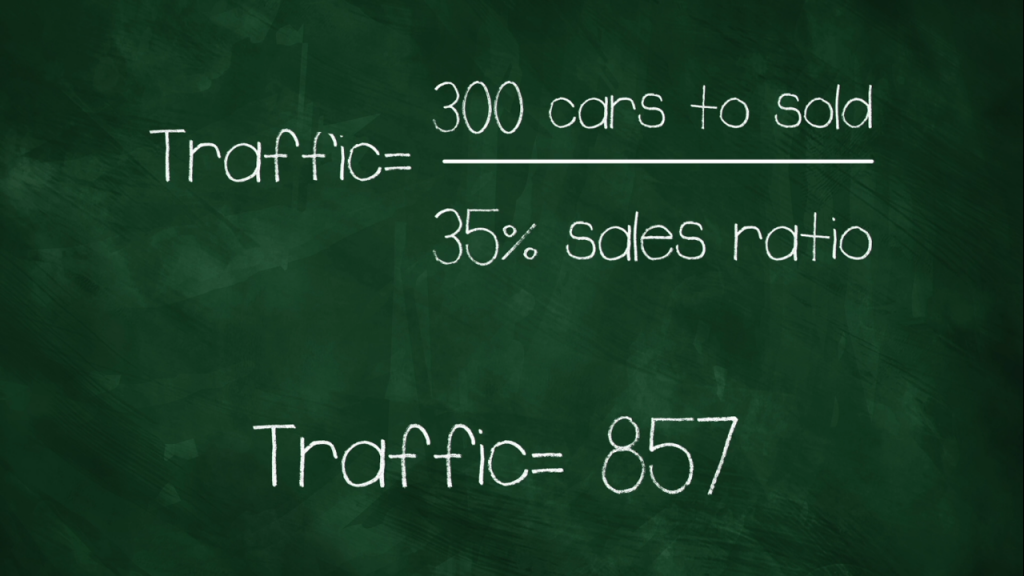
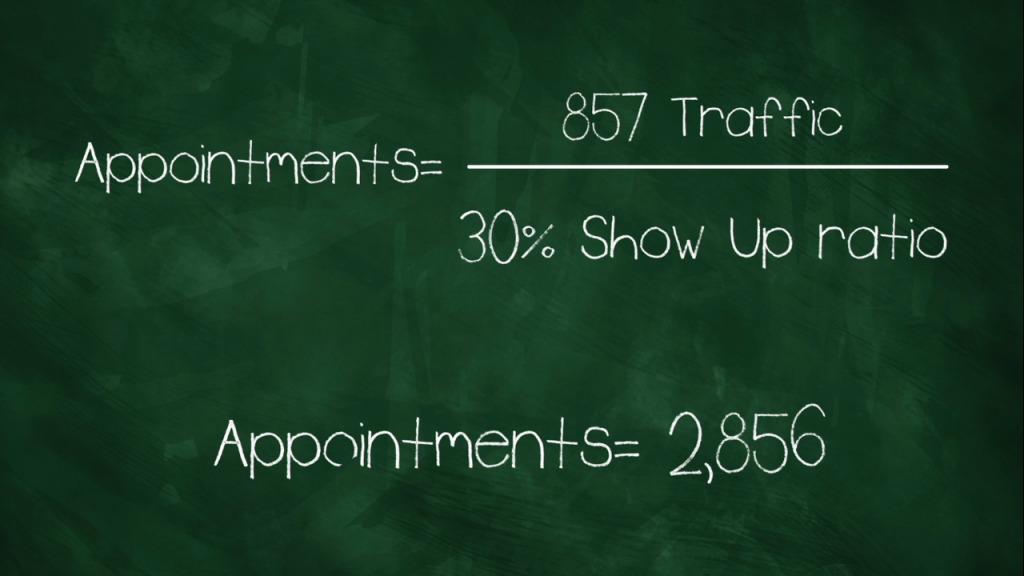
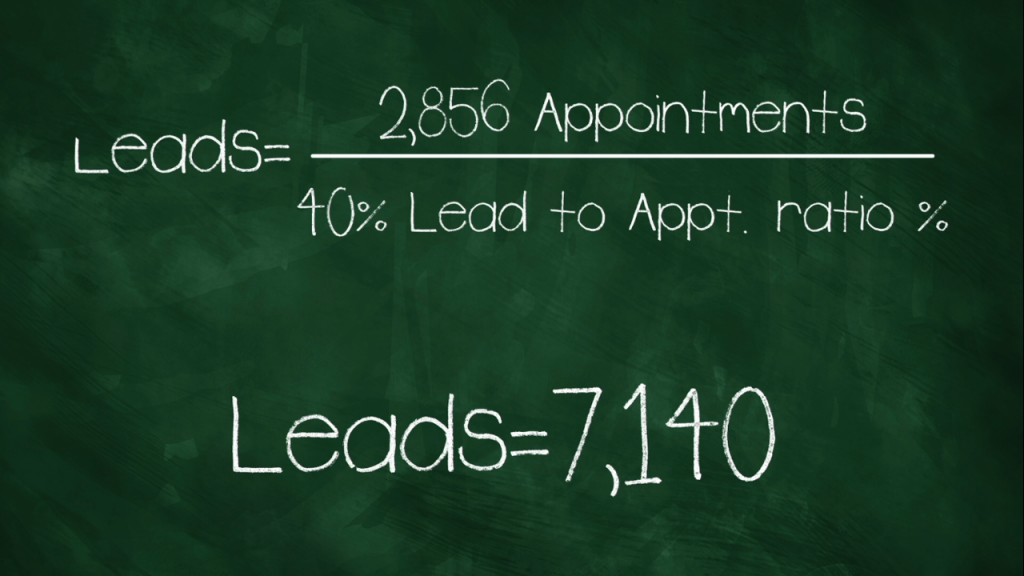
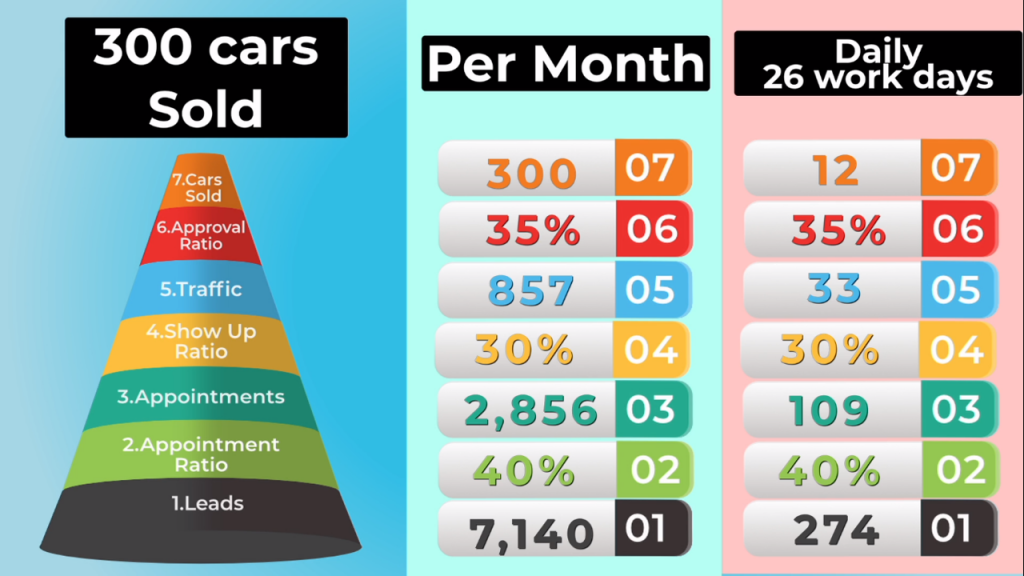
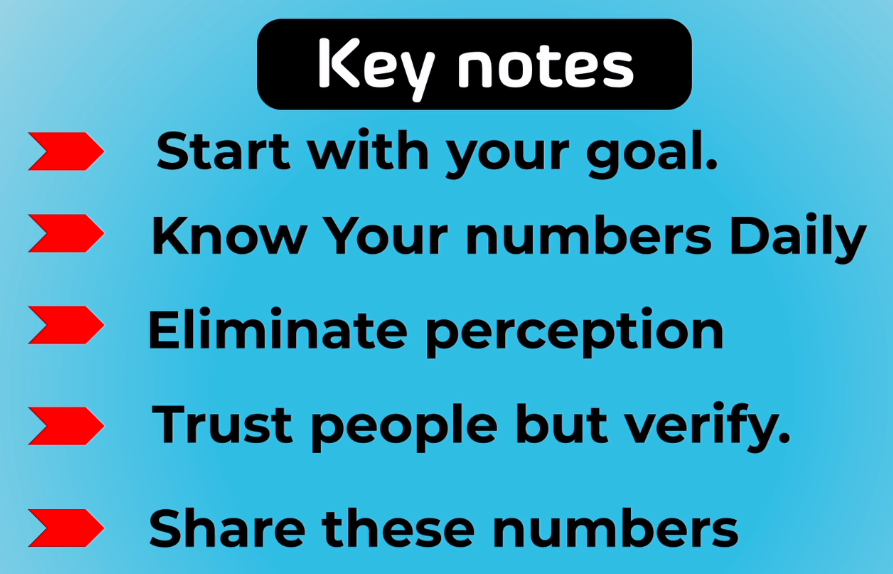
Complainers know nothing about their numbers. If they did, the dialog will be based on the specifics and where to move the needle. Hey,…maybe this video helps!

Congratulations, you made it to the end!

Thank you for stopping by and surviving another episode by DealerPromote.com.

We are passionate about anything automotive and everything that happens in your dealership.

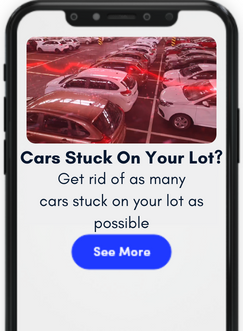
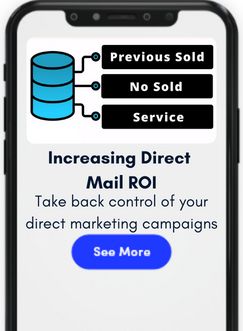
Check us out and discover a suite of digital products to increase sales and to understand and visualize your dealership from the palm of your hands.

Peace & Happy Promoting!

How to Get to Your Goal of Cars Sold

Torture Your Numbers